about us
Investment Philosophy
A partner for philanthropic individuals, families, and businesses since 1920
TFEC is a community resource that can customize and maximize your giving today and for years to come. Our investment philosophy and expertise enable you to increase the value of your fund over time while our knowledgeable staff connects you with research and resources making your charitable giving strategic and meaningful.
Total Return Policy
Overview
TFEC is entrusted with the prudent investment management of funds, and with fulfilling donor’s charitable recommendations to impact the community. Since 1996, TFEC has invested its assets according to “Total Return.” A total return policy treats all returns on investments –interest, dividends, realized and unrealized capital appreciation – as additions to principal. By using a total return investment policy, TFEC seeks to maintain or increase the real value of principal in funds, and thereby increase grant distributions over the long-term. We believe that prudent investing can offer the potential for reasonable returns, and a total return strategy is the most effective way to accomplish these investment goals.
A total return policy treats all returns on investments – earned interest, dividends, realized and unrealized capital appreciation – as a single sum for income purposes. By using total return accounting, fund income can be derived from capital appreciation rather than from current interest and dividends only.
Benefits of Total Return
A total return policy has enabled TFEC’s Board of Directors to establish spending rates each year based on fixed percentages of our asset base. Fixed spending rates moderate fluctuations in a fund’s annual distribution amount. Please review our Distribution & Spending Policies information sheet to learn how fund earnings are distributed.
A total return policy enables TFEC’s Board of Directors to maintain a spending policy based on preset percentages of principal. In other words, distributions from funds are not determined solely by current investment income, but rather by a percentage of a fund’s blended market value (blended over a five-year period). This spending policy allows for more predictable distributions over the long-term, and ongoing nonprofit organizations or scholarship grant recipients are able to rely upon a relatively stable income stream.
Management & Performance
Because TFEC must invest with a very long-term view, we have adopted a disciplined, passive investment strategy. This strategy suggests that we not try to outperform the market in any given year. Rather, in the case of equity investments, our passive strategy attempts to achieve at least the overall growth of the stock market, which since 1926 has returned on average approximately 10% annually. Research indicates that only a small percentage of investors exceed market returns over the long-term, especially when investment management fees, trading expenses, and tax consequences are figured into the equation. Since embarking on this strategy in 1996, we are proud that our investment performance has achieved or exceeded market benchmarks.
In order to realize market returns and maintain diversification at the lowest possible cost, TFEC invests in no-load, low-expense mutual funds. These funds, from reputable companies such as Vanguard and Dimensional Fund Advisors, are held wisolid separate asset-class pools. These pools, or “models,” intend to replicate the market capitalization of distinct asset classes. For instance, because a significant proportion of the stock market is invested in large cap stocks, a majority of TFEC’s equity model is allocated toward large caps. The performance of each model is monitored against benchmark indices, and TFEC makes adjustments to the fund types or allocations when warranted.
U.S. Treasury regulations of community foundations require separate fund accounting. Therefore, even though all fund assets are pooled, TFEC separately accounts for each fund as to changes resulting from contributions, investment purchases and sales, and distributions.
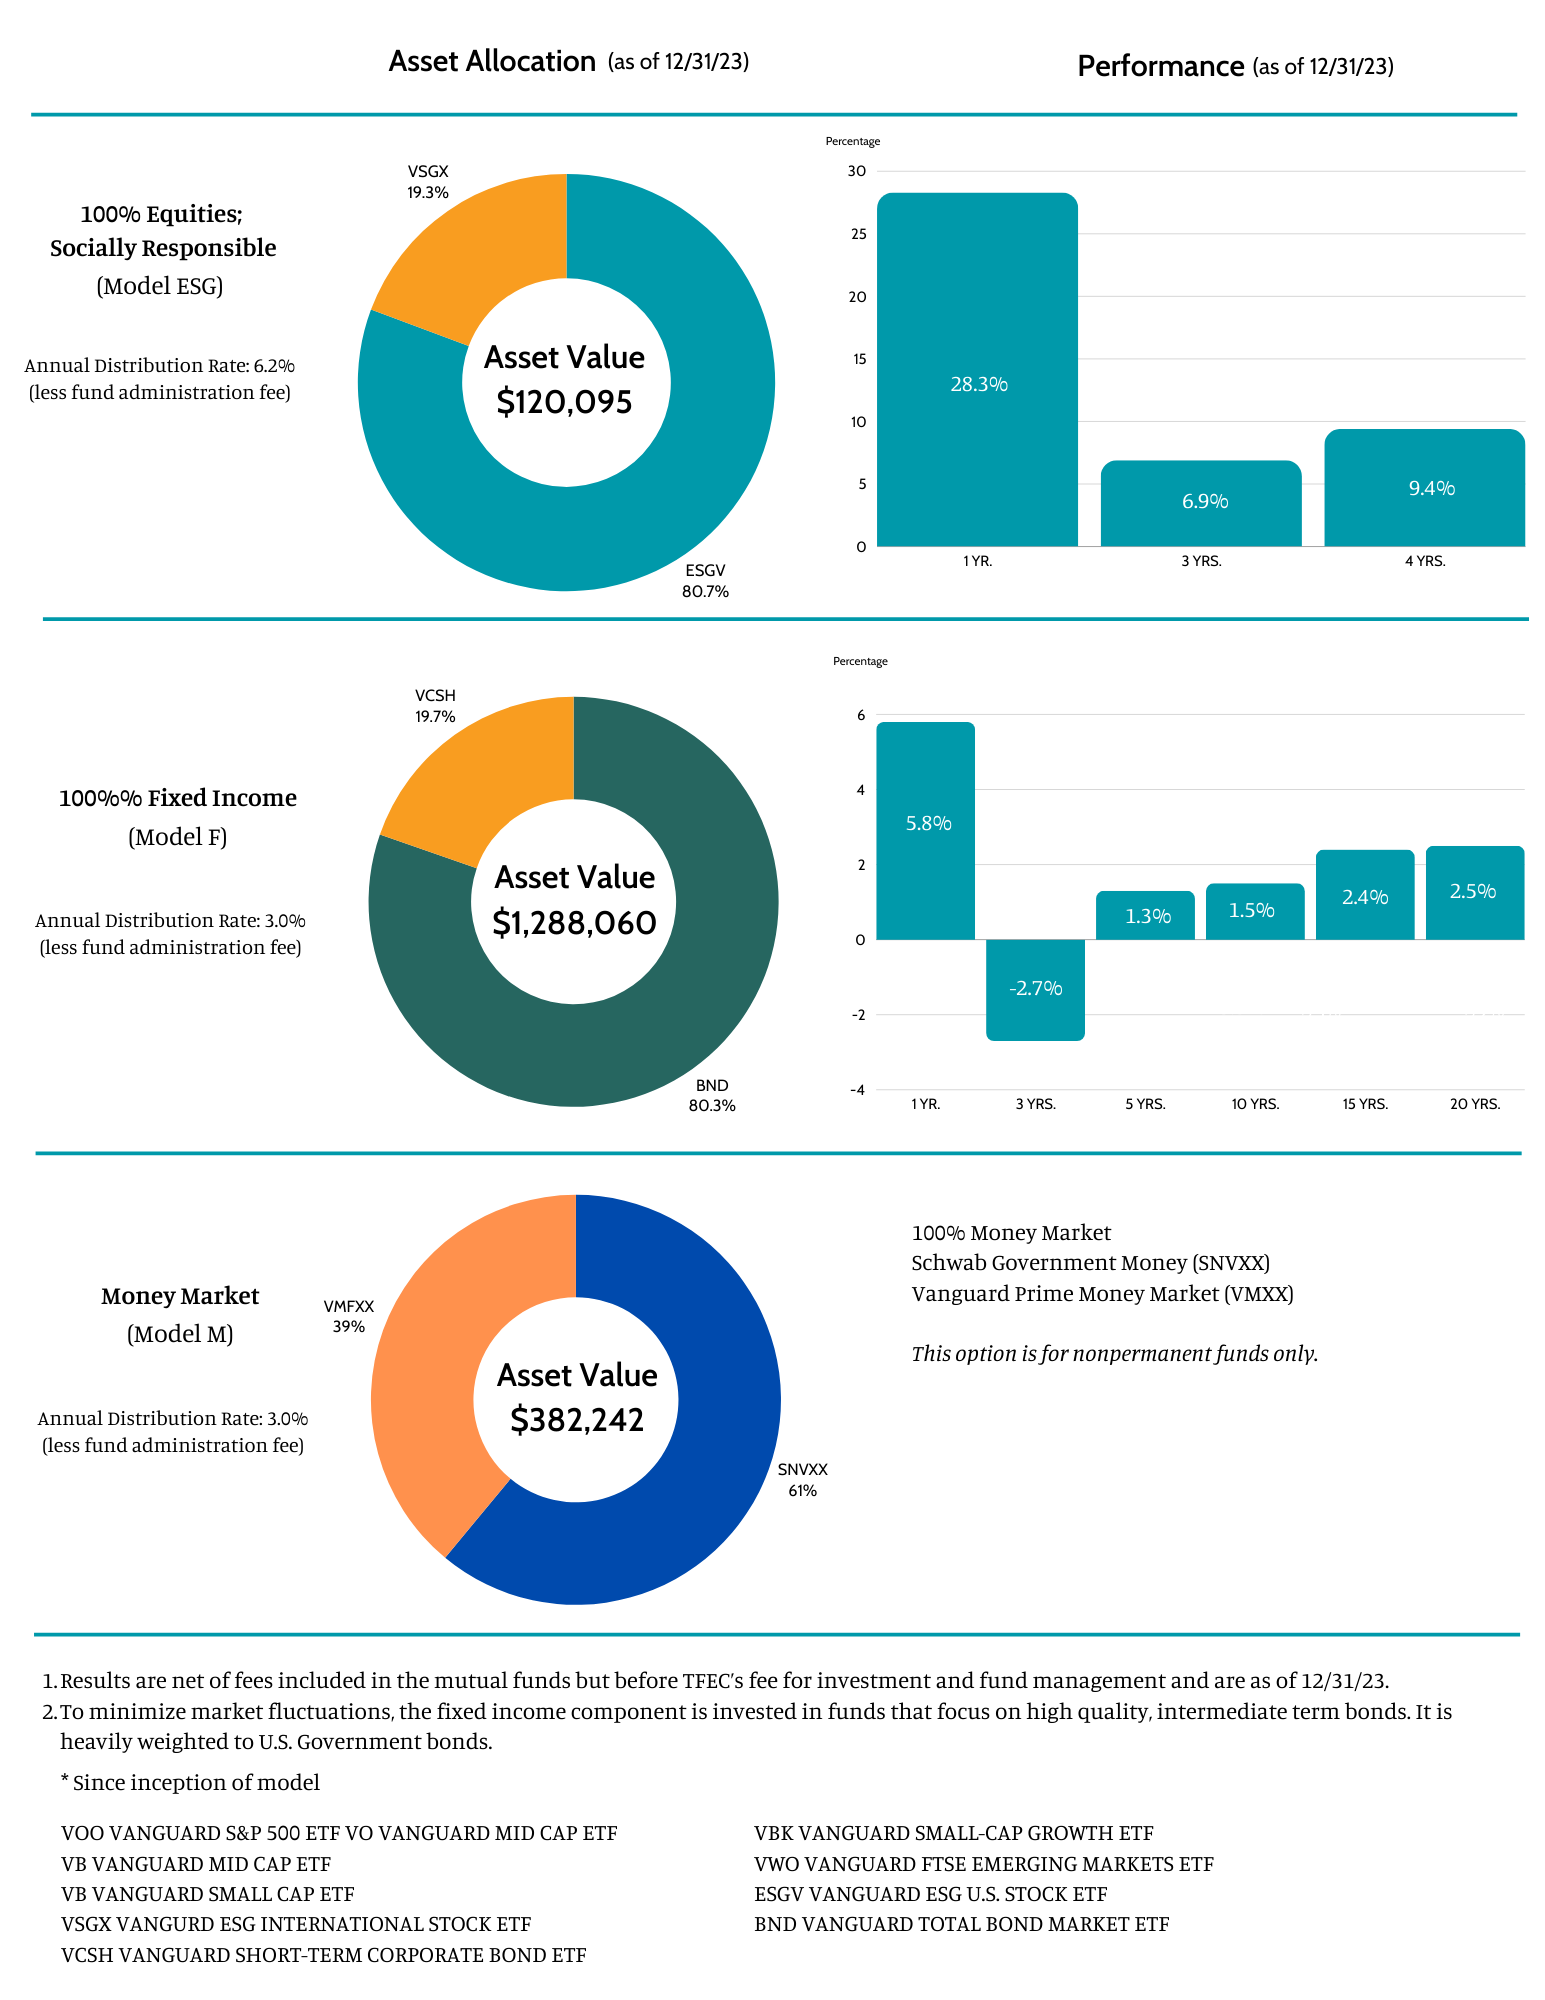
Since implementation of the current investment policy in 1996, few and minor changes have been made to the overall investment philosophy. Two such changes were the addition of Model F, a 100% fixed asset model in mid-2003 and Model E-ESG, which uses environmental, social and governance standards for a company’s operations that socially conscious investors use to screen potential investments in late 2019. TFEC’s Investment Advisory Committee closely monitors the investment performance and advises changes as needed.
Investment Analysis
The Foundation for Enhancing Communities and Conrad M. Siegel, Fellow, Society of Actuaries, Investment Advisor Representative, Former Chair of TFEC, Former Chair of Investment Advisor Committee and current Member of Investment Advisory Committee have just completed an analysis of their investment and spending policies which were implemented in 1996 to include passive management using mutual funds and total return including realized and unrealized appreciation as the basis of measuring returns to individual funds. This analysis covers the period thru December 31, 2015 which encompasses a 20 year history. The results are both impressive and rewarding given the fact that over this 20 year period many changes occurred throughout the world which drastically effected the markets thus making it difficult to stay the course, ride out the rough patches and reap the rewards.
Distribution & Spending Policies
Each fund at TFEC is fully invested according to the investment model(s) recommended by the donor who establishes the fund. When subsequent contributions are received into a fund, they are invested immediately. New donations contribute to the fund’s total market value regardless of the fund’s size.
What is the Distribution Amount?
The Distribution Amount is the amount available each year for grantmaking out of a permanent endowment fund. Unlike private foundations, which must spend at least 5% of their assets each year, permanent funds at a community foundation are not subject to mandatory spending requirements. Also, the distribution amount either can be spent out as grants or reinvested in the fund, depending upon the type of fund.
By policy, if a fund has not achieved its minimum contributions requirement ($10,000 within five years), the annual distribution amount will be reinvested automatically.
How is the Distribution Amount calculated?
A fund’s distribution amount is determined annually by using two factors: the Spending Policy Rate (SPR); and the Blended Market Value (BMV). After January 1 of each year, TFEC multiples the Blended Market Value by the appropriate Spending Policy Rate (net of administration fees). The resulting figure becomes the available distribution amount for the current year. For example, 4.75% net SPR x $10,000 BMV = $475 distribution amount.
How are Spending Policy Rates determined?
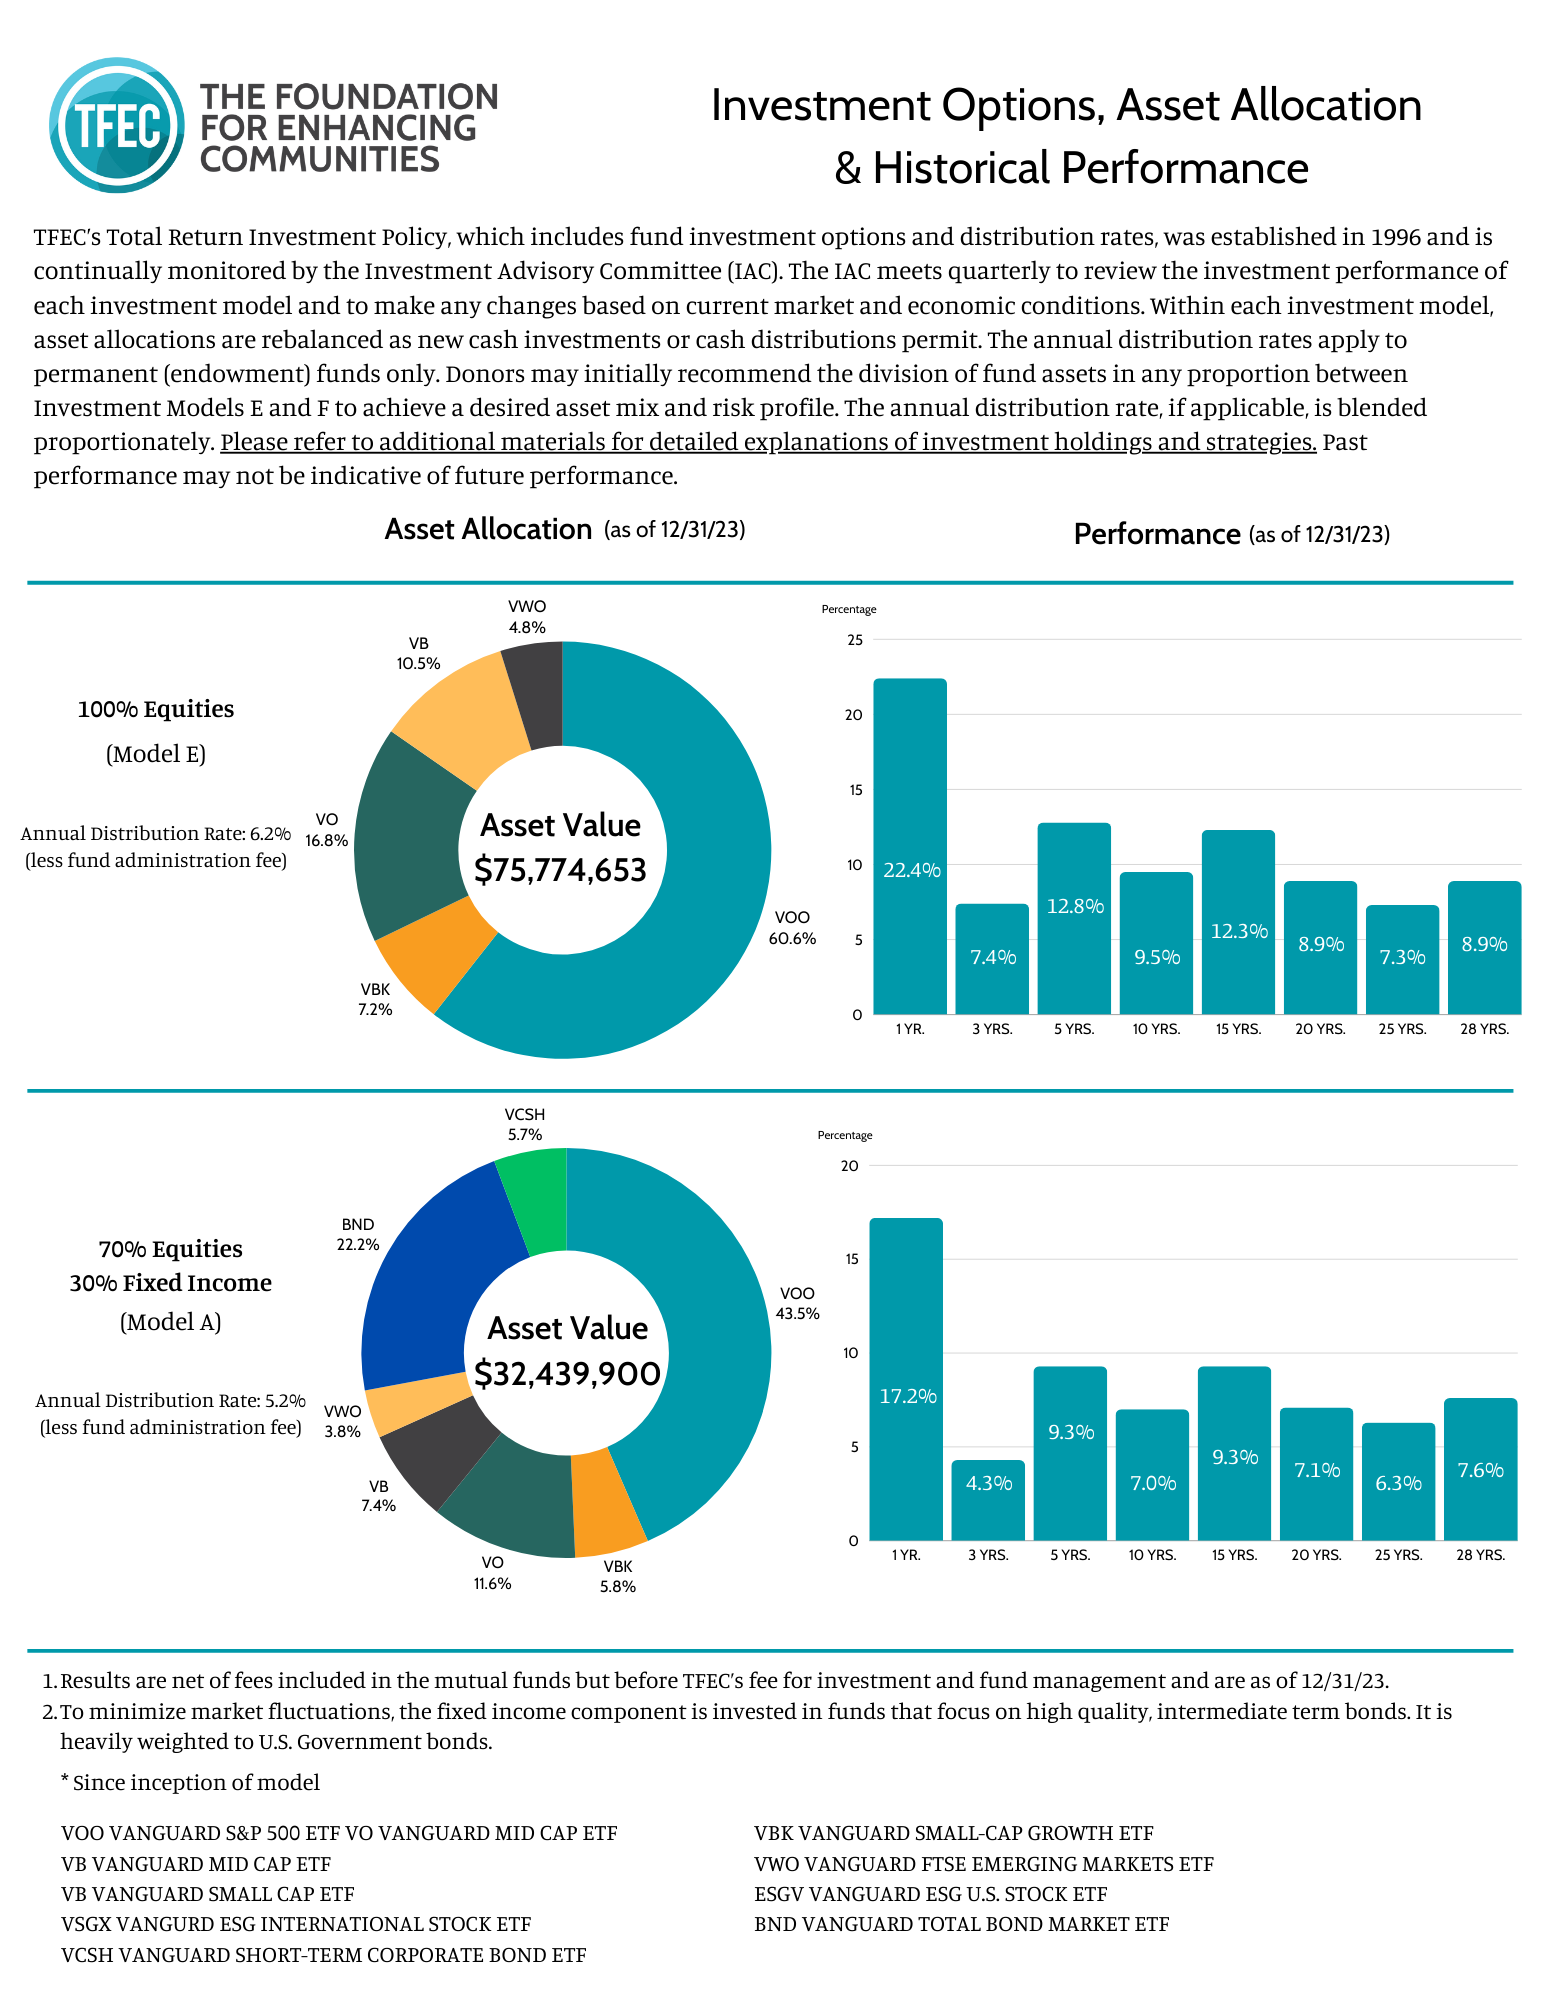
The Spending Policy Rates (SPR’s) are established and reviewed regularly by TFEC’s Investment Advisory Committee. SPR’s are set at levels that enable distributions to grow over time, and to hedge against the eroding effects of inflation. Currently, annual rates are 6.2% for Model E investments, 6.2% for Model E-ESG investments, 5.2% for Model A, and 3.0% for Model F. SPR’s are listed net of TFEC’s annual investment fees (currently 0.4% for all funds), but do not include annual administration fees (which vary by fund type). For those funds with a mixture of investment models, SPR’s are blended proportionately.
What is Blended Market Value?
Conceptually, Blended Market Value (BMV) is a five-year trailing average of a fund’s market value. However, our calculation not only takes into account the actual market value, but also what we expect the value to be based upon the historical performance of the broad market. For example, we expect Model E investments (100% equity funds) to return an average 9.6% growth per year. This rate of return is the historical average increase of the broad stock market since 1926. Over the long-term, then, we expect the stock market to “regress to the mean” and achieve a 9.6% annual return.
To calculate BMV for a Model E fund, we add 9.6% to the prior year BMV – regardless of actual returns – and then adjust for the effects of inflation, new contributions, grant distributions, and fees. The resulting figure becomes the fund’s “expected market value.” The expected market value is then compared to the actual market value, and the dollar difference – a gain or loss – is amortized over five years. Similar calculations are done for Model A and Model F investments. The net effect is that single-year gains and losses are smoothed out significantly.
A protective feature in the calculation is the application of an 80-120% collar. During highly volatile market conditions, this collar prevents the blended market value from fluctuating too far from actual market value (AMV), thereby avoiding excessive distributions. If BMV falls below 80% of the fund’s AMV, then BMV is set to 80% of AMV. Similarly, if BMV climbs above 120% of AMV, then BMV is set to 120% of AMV.
Conclusion:
Our overall goal is to ensure long-term fund stability, so that each distribution amount does not vary precipitously, up or down, from the prior year. If we were to distribute a fund’s actual annual returns, the result would be wide swings in the amount available for grants from one year to the next. Moreover, it would not be possible to ask nonprofit agencies to return grants when investment returns were negative. TFEC’s calculations serve to level market fluctuations and maintain relatively smooth distribution amounts.
Note: Nonpermanent funds do not have distribution amounts. Distributions can be made from both principal and interest, and nonpermanent funds can be spent down to zero.
Investment Pools & Historical Performance
Additional Reading
For persons interested in exploring the rationale for our use of index funds, we recommend:
- A Different Dimension – Article Written by Barron’s
- “The Index Fund Solution” by Richard E. Evans
- “The Only Guide to a Winning Investment Strategy You’ll Ever Need” by Larry E. Swedroe
- Any book by John Bogle, founder of Vanguard and developer of the first commercially successful index fund
There is no particular magic to investing in index funds over actively managed funds. Index fund performance is generally superior because of lower fees and expenses, less trading with lower trading costs, and no need to maintain uninvested cash for redemptions. Additionally, the substantial growth in TFEC’s assets affords us certain advantages of size. For example, the Vanguard Institutional Index is a Standard & Poor 500 Fund with expenses of six basis points and a $10 million minimum. Similarly, the DFA funds have a $2 million minimum and charge one-half to one-third the fees charged by actively managed funds.
TFEC continually strives to be an attractive venue for maximizing donor’s charitable dollars to benefit the community.
Frequently Asked Questions
Author: Conrad M. Siegel, Past Chairman, Investment Advisory Committee & Board of Directors
Our donors, recipient agencies, and potential donors have asked many questions about our investment policy, spending policy and fee structure. Since the majority of our funds are invested under Model E (100% equity funds), the illustrations below are based upon this model. The fee and spending policy are based on an Agency Fund type. The final questions illustrate the differences for investment Models A and F, and other fee levels.
FAQ1. What prompted the change in policy effective the beginning of 1996?
Answer:
Our grant distributions to charities were declining due to the drop in interest rates on bonds and low dividend yields on stocks. We were distributing interest and dividends only, and because our investment policy was yield-oriented, we avoided growth stocks that paid little or no dividends.
FAQ2. What changes were made?
Answer:
We adopted a total return philosophy that seeks not only interest and dividends, but also capital appreciation, both realized and unrealized.
FAQ3. How did this change affect your spending policy?
Answer:
The spending rate policy produces the amount that can be granted out of a fund each year. Instead of “spending” interest and dividends only, we adopted a spending policy of 6.2% of blended market value (for funds invested in Model E). The rate is designed to allow for inflationary growth in future distributions.
FAQ4. Does this spending rate include any fees?
Answer:
This rate is net of an annual investment management fee of 0.4%, which offsets TFEC’s expenses related to investment execution and processing. All fund types, except those held by outside Custodians, are subject to the same annual investment management fee of 0.4%. The gross spending rate is 6.2%, less the administrative fee discussed below.
FAQ5. Are there other fees charged against the spending rate?
Answer:
Yes. TFEC’s administrative fees for a particular type of fund also are charged monthly. Depending upon the type of fund, administrative fees currently range from 1.45% to 2.70%. For example, an Agency Fund invested in Model E has an annual administrative fee rate of 1.45% of market value of assets. Therefore, the net spending rate becomes 4.75%, or 6.2% less the 1.45% administration fee. This net spending rate, when applied to blended market value (see FAQ6), results in the amount to be distributed to the grantee.
FAQ6. Why isn’t the spending policy rate applied to the fund’s market value each year?
Answer:
The net spending rate is applied to a “blended market value,” which is an average of market values over a five-year period. The blending calculation smoothes out market upswings and downturns, and spreads out investment returns over five years. It also allows for full-value growth from new contributions. In order to prevent the blended market value from deviating too far from the actual market value, the blended market value is not less than 80% or more than 120% of the actual market value. The combination of these calculations enables the fund to generate relatively stable spending amounts regardless of market fluctuations.
FAQ7. Why not distribute the current year’s actual market return?
Answer:
It is, of course, possible for the current return to be negative, as occurred in the period 2000-2002, 2008, 2011, 2015 and 2018 when the stock market declined. Without having a blended market value, funds could not, make grants in negative years, and it would not be possible to ask agencies to give money back to TFEC. What we are trying to do is achieve stability in the spending amount so that one year’s distribution does not vary precipitously, up or down, from the prior year.
FAQ8. How do you choose your investments?
Answer:
Our investment policy is largely based on the use of mutual funds invested in common stocks indices and passive portfolios. We use mutual funds to achieve adequate diversification, rather than purchasing individual stocks.
FAQ9. What are index mutual funds?
Answer:
Index mutual funds buy stocks that mirror recognized performance benchmarks. The indices weight the effect of each stock by the number of shares outstanding and the market value of each share. The well-recognized indexes that we use include the S&P 500 Index (large capitalization stocks), the Russell 2000 (mid-capitalization stocks), and the MSCI EAFE (international stocks).
FAQ10. Index fund investing is passive. Why not choose actively managed mutual funds?
Answer:
S&P 500 index funds have outperformed 80% of the managed general equity mutual funds over the past twenty years. We seek to achieve the results of the index and are willing to forego the chance of picking a better performing fund from the remaining 20%. Similarly, the mid-cap and small-cap index funds have outperformed actively managed funds of similar investment guidelines.
FAQ11. Are all of your investments in index funds?
Answer:
No. We invest in the Vanguard 500, Vanguard Mid Cap, the Vanguard Small Cap and Small Cap-Growth ETF, Vanguard FTSE Emerging Markets ETF, Vanguard Total Bond Market ETF and Vanguard Short-Term Corporate Bond ETF. The Vanguard Funds adhere to traditional indexing strategies.
FAQ12. Why are the majority of your equity investments in an S&P 500 Index fund?
Answer:
In order to achieve the returns of our benchmark, we hold approximately the proportion of the market capitalization of the S&P 500 to the total U.S. market capitalization.
FAQ13. The world-wide market capitalization shows that non-U.S. stocks amount to 50-60% of the world-wide market capitalization. Why is your international component less than these figures?
Answer:
Our requirements are to provide grants for charities in U.S. dollars. Non-U.S. investments involve political risk, currency risk, liquidity risks of securities markets (which are much less liquid than U.S. securities markets), and the uncertainty of accounting standards (which are less rigorous than U.S. standards). Actually, when we determined our investment policy in late 1995, the market capitalization of non-U.S. stocks amounted to about 80% of the world market capitalization. The U.S. market, our principal investment vehicle, had done much better since 1996, with some exceptions, than the foreign markets. In addition, many of the companies in the U.S. index portfolio, such as Coca Cola, Gillette and McDonalds, have very significant international investments.
FAQ14. The S&P 500 index is dominated by large blue chip companies such as GE, Exxon and Microsoft. Aren’t you in danger of “chasing” those stocks like investment managers did in the 1970’s with the “nifty 50” stocks such as Polaroid and IBM, which then suffered significantly in the 1980’s and 1990’s?
Answer:
The strength of the index is that the collective investment wisdom of the entire market determines the number of shares that are outstanding and their price per share. Thus, an automatic adjustment is made every day for the different weighting within the index of each stock. This is different from the “one-decision” stocks of the 1970’s.
FAQ15. Why have index funds performed so well relative to actively managed funds?
Answer:
Part of this performance is due to lower fees charged against indexed funds. Also, commissions paid on security transactions are very low because of the large size of the funds. In addition, almost no un-invested cash is maintained by the funds, and there is very little asset turnover.
FAQ16. What if the stock market falls by 20%?
Answer:
It has done so! However, this doesn’t cause a problem because we are investing these funds in perpetuity and our only requirement is that we must satisfy our spending policy. Because our blended market value calculation averages investment returns over a five-year period, a 20% drop in the market would involve a relatively small change in the spending amount for the next year. We also employ an 80% – 120% collar of actual market value, which keeps the funds’ blended market value from diverging too far from actual market returns.
FAQ17. Is the market too high now? Why not sell and get back in when it is lower?
Answer:
We have never seen any objective studies of the success of “market timing.” Market timing involves two critical decisions—when to get out and when to get back in. Our policy is to be fully invested.
FAQ18. Is it appropriate to invest 100% in equities?
Answer:
John Bogle, founder of Vanguard Investments, studied the investment results over 121 years from 1872 to 1992. He found average annual returns to be 8.8% for large capitalization stocks, 4.6% for long-term bonds and 4.2% for short-term treasuries (see Bogle on Mutual Funds). The superiority in the very long-term of common stocks is compelling, especially in our situation where the investment is perpetual and only a return on investment is desired (we don’t have a need to take lump sum cash out of the investment). The recent decade, of course, illustrates what can happen in the market. Common stock returns over the years are as follows:
| Beginning of | to | End of | Annual Return | |
| 1872 | 1925 | 7.0% | ||
| 1926 | 1969 | 9.6% | ||
| 1970 | 1997 | 13.0% | ||
| 1980 | 2001 | 13.0% | ||
| 2001 | 2011 | 1.5% | ||
| 2011 | 2015 | 12.6% |
By using a conservative spending rate, such as 4.75% net, applied to a five-year blended market value, we provide a reasonable approach to endowment management. TFEC also offers investment Model A, with 70% equities & 30% fixed income investments, as an available alternative. In addition, we offer Model F, a 100% fixed income fund. Model F may be combined in any proportion with Model E to achieve whatever asset allocation mix (and risk tolerance) is desired.
FAQ19. How does the Model A investment model differ from Model E?
Answer:
Model A, being a 70% stock & 30% fixed income policy, is expected to have lower total returns over the long term, but less year-to-year volatility. The 70% equity portion is invested in the same funds as Model E. The remaining 30% is invested in fixed income mutual funds of mid-term duration. The net spending policy for Model A is 3.75%, rather than 4.75% (assuming an agency fund).
FAQ20. So far, you have been discussing agency funds. How do these answers differ for other types of funds?
Answer:
Higher administrative fee rates, which reflect increased work in dealing with grant making, result in a lower “expected” return rate for those funds. The net spending rate for other types of funds reflects the increased work in grant making.
FAQ21. How do these answers differ for charitable remainder unitrusts?
Answer:
Our investment models are also available for charitable remainder unitrusts. However, by the very nature of unitrust, the unitrust spending rate, initially established at the inception of the unitrust, must be applied to the January 1 market value and not an averaged market value. Thus, the dollars paid out will reflect greater year-to-year fluctuations. Generally, when funds donated to a unitrust consist of stocks which are yielding about 1 1/2% – 2% at market and the unitrust pays 5% – 10%, the gross distribution improves significantly. Thus, even a significant reduction in market value is likely to keep the total income distribution at a higher level than before the unitrust was established.
FAQ22. Are these provisions subject to change?
Answer:
Yes. The Investment Advisory Committee and the Board of Directors periodically evaluate these policies and modify them if appropriate. Investment returns may fluctuate significantly from time to time, and past results may not be indicative of future performance. Our policies, however, are based upon long-term outlook and are not designed for frequent revision.